Western
| LAST n DAYS | 1 | 3 | 7 | 14 | 21 | 30 | 60 | 90 | 120 | 180 | 360
|
| AVE TEMP | 59 | 60 | 62 | 57 | 56 | 55 | 47 | 42 | 42 | 46 | 60
|
| DEPART. | 6 | 7 | 10 | 6 | 6 | 6 | 3 | 1 | 2 | 2 | 2
|
| PRECIP | 2.31 | 3.64 | 4.61 | 4.80 | 6.69 | 6.77 | 14.64 | 18.89 | 24.77 | 31.09 | 61.93
|
| DEPART. | 2.16 | 3.18 | 3.55 | 2.66 | 3.50 | 2.18 | 5.92 | 6.82 | 8.57 | 7.03 | 12.47
|
| %NORM | 1540 | 791 | 435 | 224 | 210 | 147 | 168 | 157 | 153 | 129 | 125 |
Central
| LAST n DAYS | 1 | 3 | 7 | 14 | 21 | 30 | 60 | 90 | 120 | 180 | 360
|
| AVE TEMP | 64 | 60 | 62 | 56 | 55 | 54 | 47 | 41 | 42 | 46 | 59
|
| DEPART. | 11 | 7 | 10 | 5 | 5 | 6 | 3 | 0 | 1 | 2 | 1
|
| PRECIP | 3.58 | 3.72 | 4.67 | 4.99 | 8.51 | 8.81 | 17.10 | 20.91 | 26.15 | 31.36 | 62.29
|
| DEPART. | 3.43 | 3.26 | 3.61 | 2.88 | 5.33 | 4.20 | 7.95 | 7.97 | 8.72 | 6.42 | 10.51
|
| %NORM | 2387 | 809 | 441 | 236 | 268 | 191 | 187 | 162 | 150 | 126 | 120 |
Bluegrass
| LAST n DAYS | 1 | 3 | 7 | 14 | 21 | 30 | 60 | 90 | 120 | 180 | 360
|
| AVE TEMP | 64 | 58 | 60 | 53 | 54 | 52 | 45 | 39 | 39 | 44 | 57
|
| DEPART. | 13 | 8 | 10 | 5 | 7 | 6 | 4 | 0 | 1 | 2 | 1
|
| PRECIP | 2.51 | 2.54 | 3.55 | 4.29 | 6.83 | 7.10 | 13.79 | 16.30 | 20.33 | 25.18 | 48.78
|
| DEPART. | 2.37 | 2.11 | 2.52 | 2.22 | 3.75 | 2.73 | 5.64 | 4.87 | 5.09 | 3.19 | 1.32
|
| %NORM | 1793 | 591 | 345 | 207 | 222 | 162 | 169 | 143 | 133 | 115 | 103 |
Eastern
| LAST n DAYS | 1 | 3 | 7 | 14 | 21 | 30 | 60 | 90 | 120 | 180 | 360
|
| AVE TEMP | 70 | 61 | 62 | 55 | 55 | 53 | 46 | 41 | 41 | 45 | 58
|
| DEPART. | 19 | 11 | 12 | 6 | 8 | 7 | 4 | 2 | 2 | 3 | 2
|
| PRECIP | 1.76 | 1.77 | 2.70 | 3.28 | 4.82 | 5.15 | 12.19 | 15.48 | 19.85 | 23.17 | 48.65
|
| DEPART. | 1.61 | 1.34 | 1.71 | 1.29 | 1.78 | 0.73 | 3.62 | 3.26 | 3.44 | 0.09 | -0.94
|
| %NORM | 1173 | 412 | 273 | 165 | 159 | 117 | 142 | 127 | 121 | 100 | 98 |
Statewide
| LAST n DAYS | 1 | 3 | 7 | 14 | 21 | 30 | 60 | 90 | 120 | 180 | 360
|
| AVE TEMP | 64 | 60 | 62 | 55 | 55 | 54 | 46 | 41 | 41 | 45 | 58
|
| DEPART. | 12 | 8 | 11 | 5 | 6 | 7 | 3 | 1 | 2 | 2 | 1
|
| PRECIP | 2.54 | 2.92 | 3.88 | 4.34 | 6.71 | 6.96 | 14.43 | 17.89 | 22.77 | 27.70 | 55.41
|
| DEPART. | 2.39 | 2.48 | 2.84 | 2.26 | 3.59 | 2.46 | 5.78 | 5.73 | 6.45 | 4.18 | 5.84
|
| %NORM | 1722 | 656 | 375 | 209 | 215 | 155 | 167 | 147 | 140 | 118 | 112 |
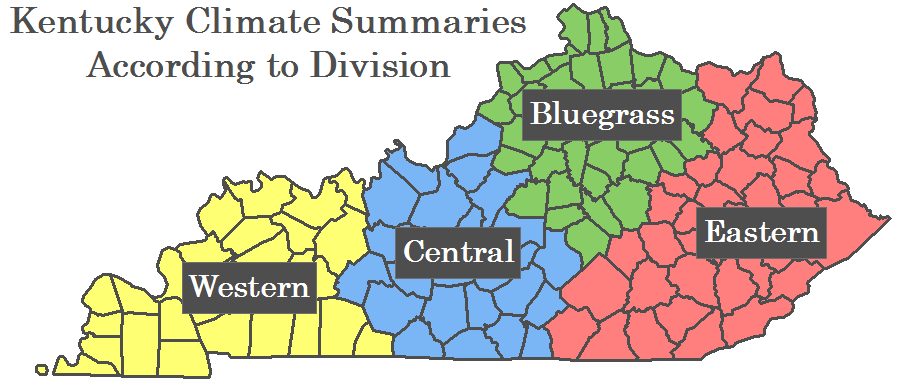
The information above provides a summary of past temperature and precipitation averages over a specific time period for each respective climate division. Each climate division is composed of the counties as separated in the map above. In interpreting each graph, just simply pick your climate period. An example would be selecting 14 to represent the average weather observations taken over the past 14 days. Throughout the column, information can be found on average temperatures and respective departures. Also included is the average precipitation totals, along with departures and the percent of normal precipitation for that period.